
How to use Analyzer
PyDISH provides several analytic tools for investigating the correlation between the distortion of heme and the axial ligands or protein function. Normal-coordinate Structural Decomposition (NSD) is a typical approach to evaluate the heme distortions. Principal Component Analysis (PCA) is one of the most famous statistical approach to extract the features with the greatest variance in a dataset (often used for finding differences among groups). Linear Discriminant Analysis (LDA) is a famous statistical method to extract a feature vector separating the data into two corresponding groups (supervised machine learning). Clustering is an unsupervised learning method for grouping a dataset.
Usage of NSD
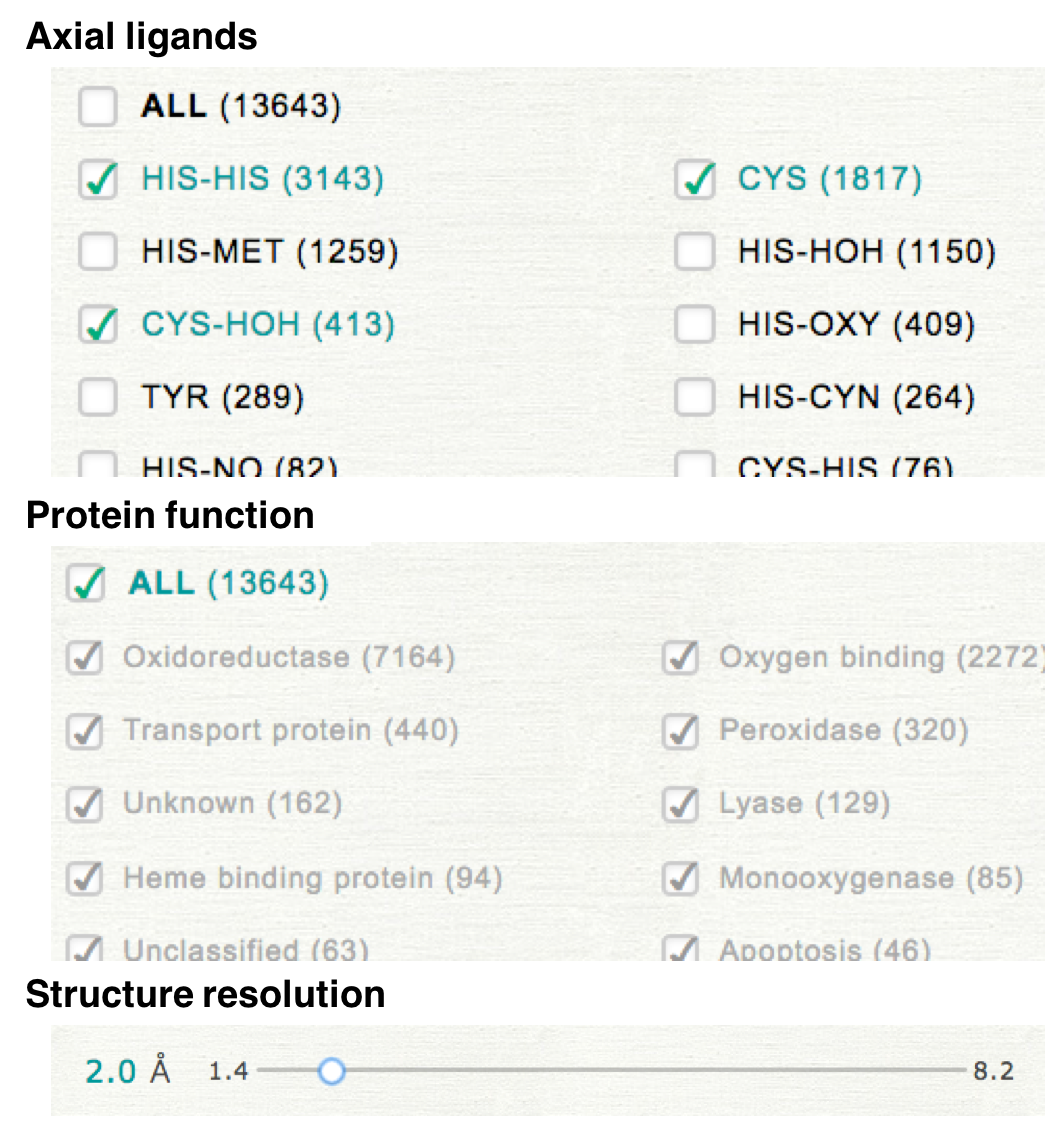
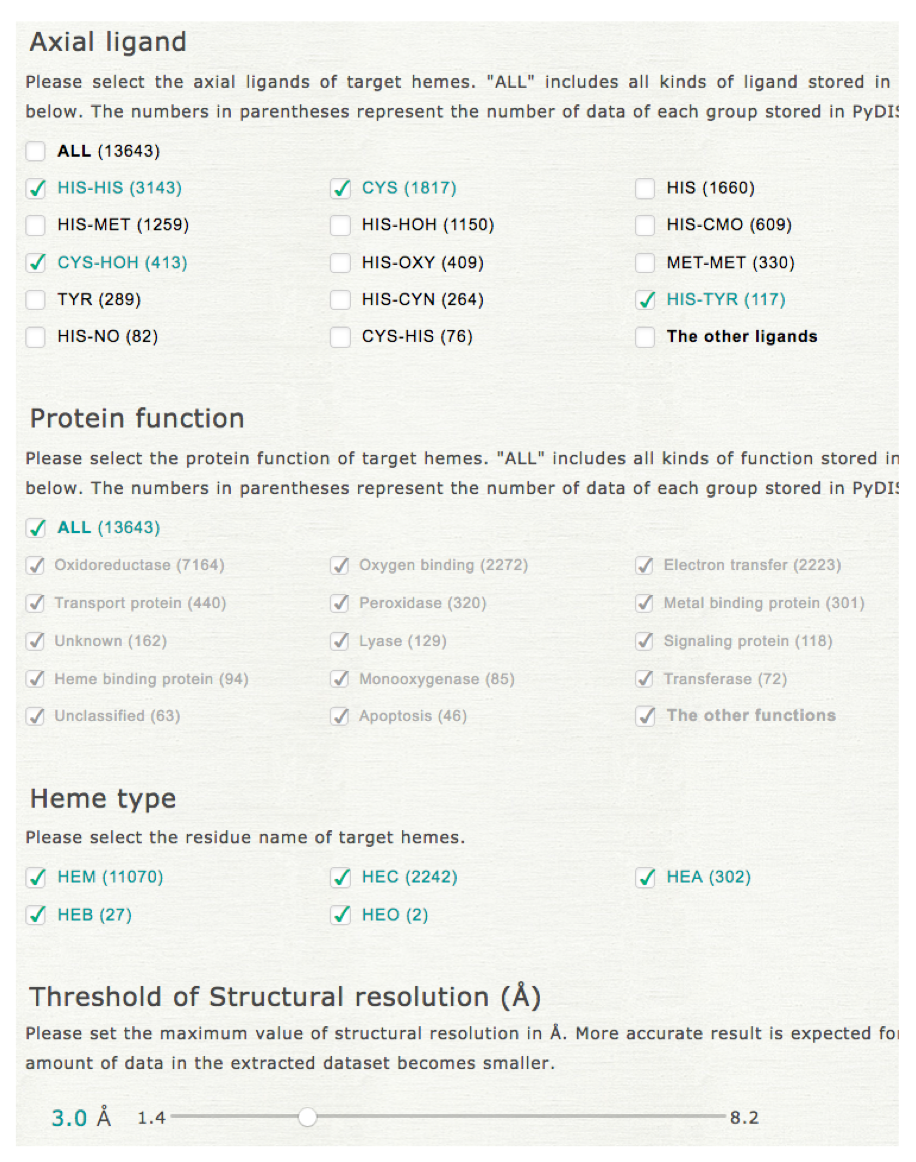
In NSD, distortion of heme porphyrin can be compared among the kinds of axial ligand or protein function. Please select the kinds of axial ligands, protein function, and threshold of structure resolution to specify a dataset.
For example, if you select the values as shown in the right upper panel, the selected dataset includes the hemes having the axial ligand of "HIS-HIS", "CYS", and "CYS-HOH". The values of structure resolution in the selected dataset are all less than 2.0 Å. The protein function is not used for the specification of the dataset.
2. Selection of the target for comparison
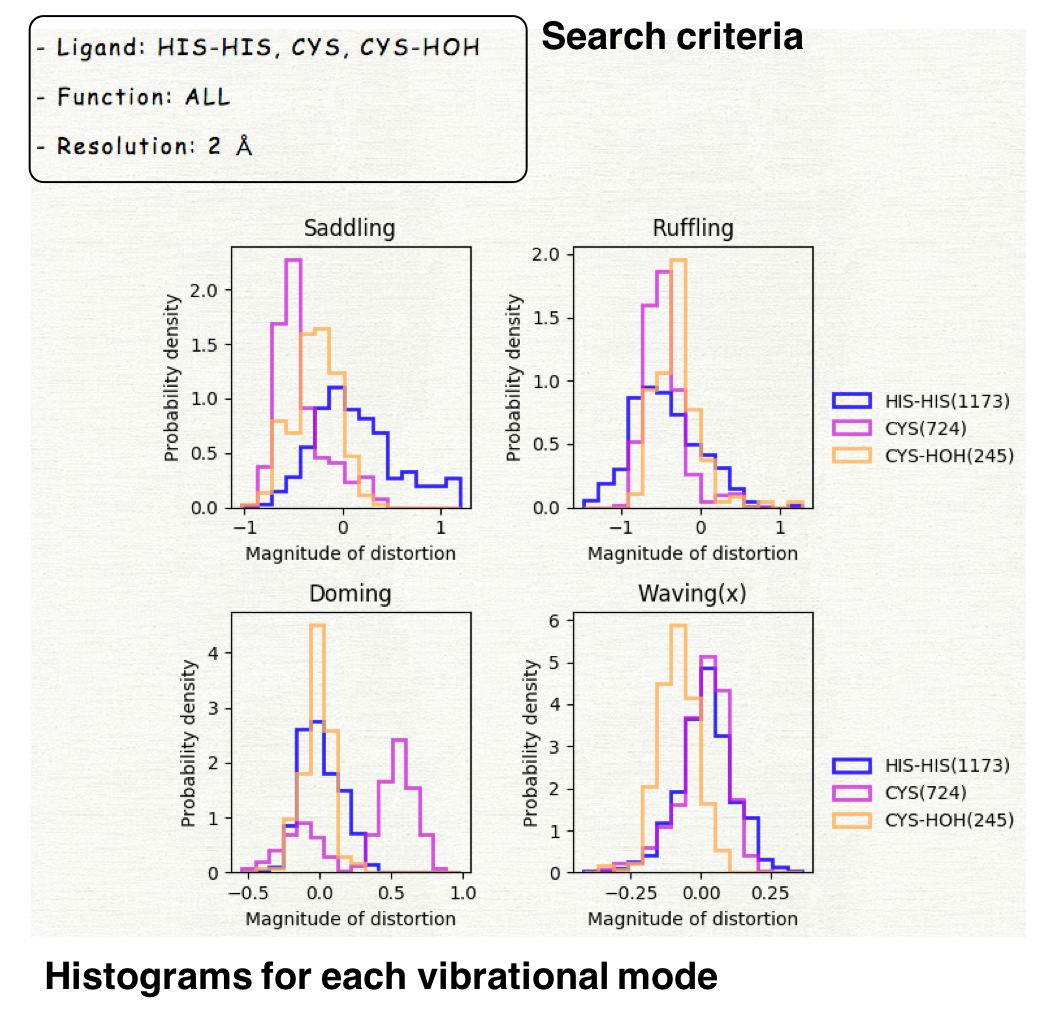
Please select the target for which the extracted data is compared. If you select "Axial ligand", the histogram will be plotted for each group of axial ligands and can be compared among ligand groups as shown in the right lower panel.
In the case when "ALL" is checked in the step 1, the histogram will be plotted for one group (whole data). If you would like to compare the distributions among all groups, please uncheck "ALL" and then check all items.
3. Execution
Click the "Analyze" button at the bottom of the page, then the result page will be open in another window or tab. ("Analyze" in white characters represents "ready to search", and that in black ones "lack of selection.")
4. Result
The histograms for 12 vibrational modes will be displayed. The horizontal axis represents the magnitude of distortion, and the vertical axis is the probability density.
Usage of PCA
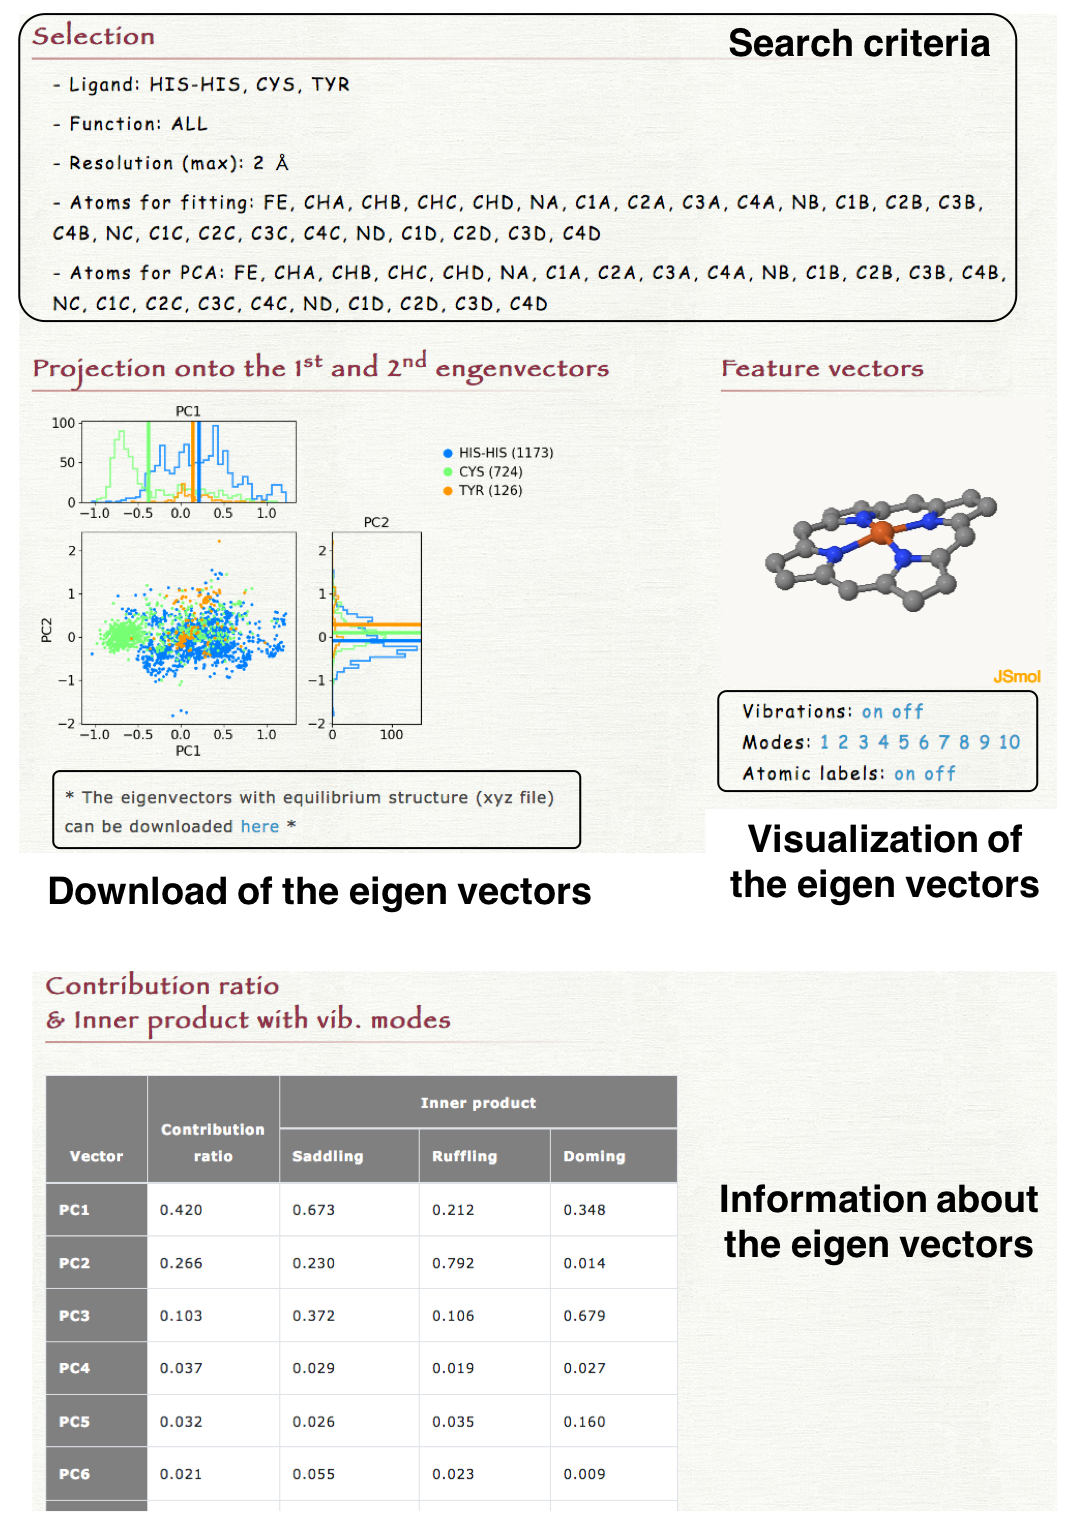
Please select the kinds of axial ligands, protein function, and threshold of structure resolution to specify a dataset.
For example, if you select the values as shown in the right upper panel, the selected dataset includes the hemes having the axial ligand of "HIS-HIS", "CYS", and "CYS-HOH". The values of structure resolution in the selected dataset are all less than 2.0 Å. The protein function is not used for the specification of the dataset.
2. Selection of the atoms used in the analysis
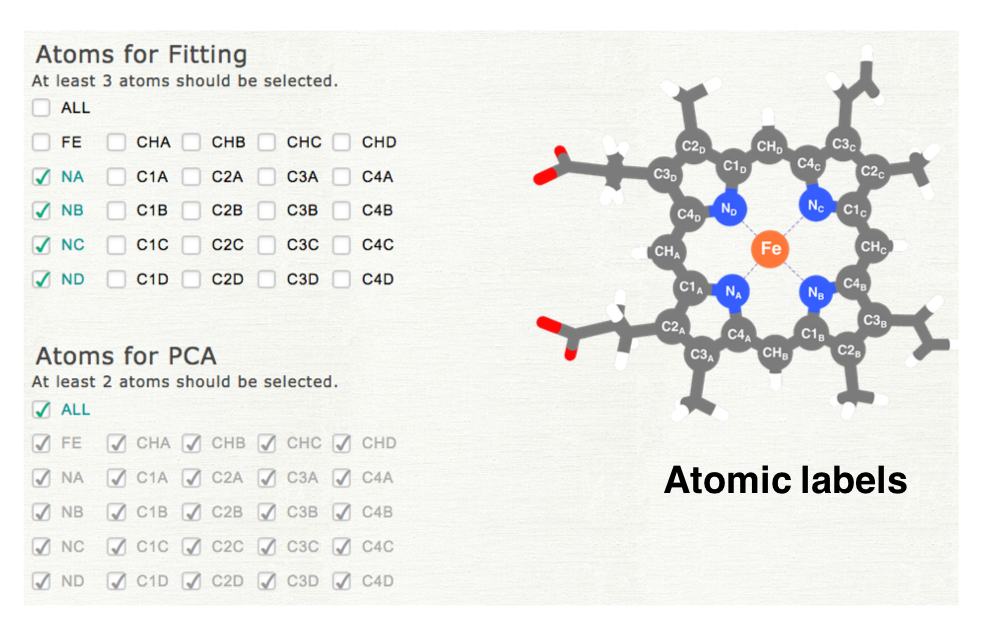
Please select the atoms used for superpotition and analysis. In the first step of PCA, all structures are superposed to the reference structure (least squares fitting). The atoms selected in "Atoms for Fitting" are used for in this process. PCA is cariied out for the coordinates of the atoms selected in "Atoms for PCA." If you select different subset of atoms, please uncheck "ALL," and then check each item. The atomic labels are shown as a figure (the right middle panel).
3. Selection of the target for comparison
Please select the target for which the extracted data is compared. Dataset will be grouped by the elements of the selected target. In the case when "ALL" is checked in the step 1, the histogram will be plotted for one group (whole data). If you would like to compare the distributions among all groups, please uncheck "ALL" and then check all items.
4. Execution
Click the "Analyze" button at the bottom of the page, then the result page will be open in another window or tab. ("Analyze" in white characters represents "ready to search", and that in black ones "lack of selection.")
5. Result
The 2-dimensional projection of the structures of each heme onto the 1st and 2nd eigen vectors is shown in "Projection onto te 1st and 2nd eigenvectors" section in the result page. The obtained eigenvectors with the equilibrium structure can be downloaded as a xyz file. In "Feature vector" section in the result page, each eigenvector can be visualized by clicking "Vibration on" as shown in the right lower panel. The index of eigenvectors can be selected by clicking the number in "Modes." The contribution ratio and the inner product with the saddling, ruffling, or doming mode of each eigenvector is also shown in the result page.
Usage of LDA
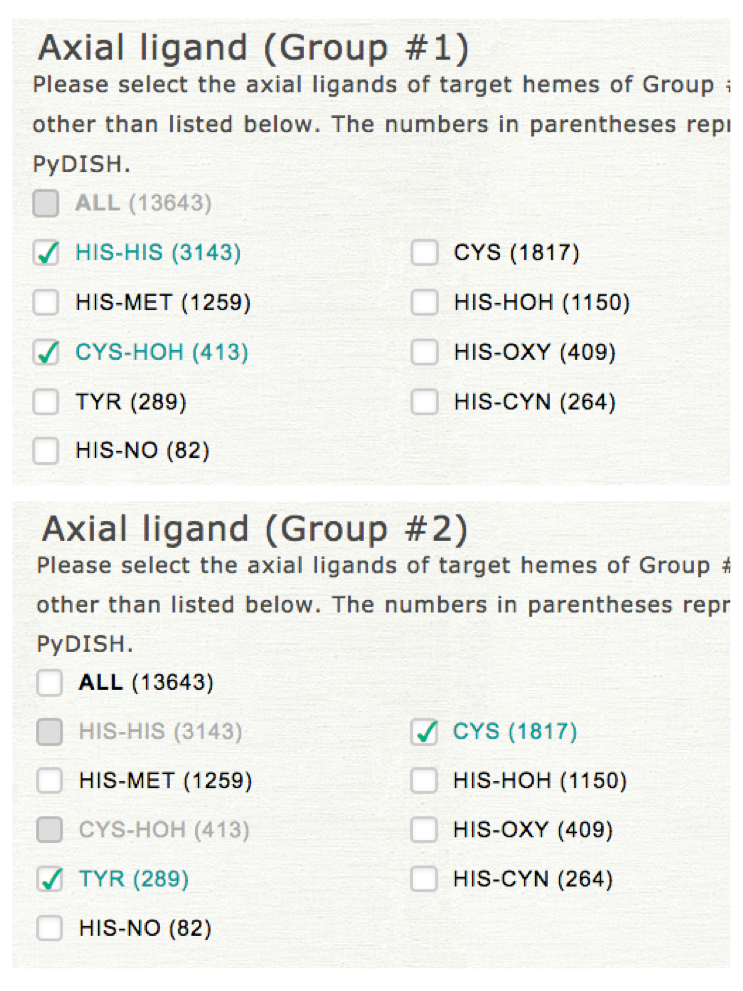
Two datasets should be specified for the classification by LDA. In this step, please select the target for which the datasets are compared. If you select the "Axial ligand," the common items cannot be selected for "Axial ligand" in the datasets specification in the next step as shown in the right upper panel (common items can be selected for "Protein function"). This selection does not affect the representation of the result.
"Structure resolution" also must be set in this step. This value is shared in the specification of 2 datasets in the next step.
2. Specification of two datasets
Please select the kinds of axial ligand and protein function to specify datasets of groups #1 and #2. In LDA the projected values of heme structures onto 12 vibrational modes (NSD) are used for the anaysis instead of atomic coordinates.
3. Execution
Click the "Analyze" button at the bottom of the page, then the result page will be open in another window or tab. ("Analyze" in white characters represents "ready to search", and that in black ones "lack of selection.")
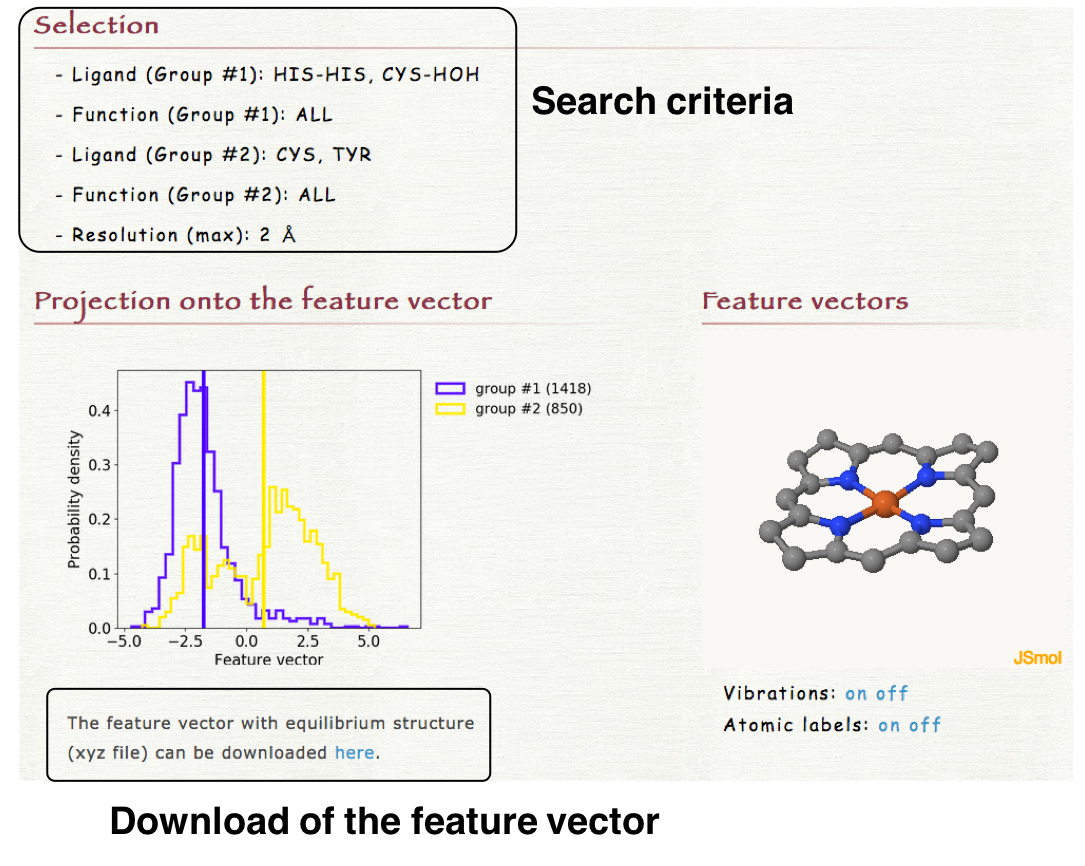
4. Result
The distribution of the structures of each heme projected onto the feature vector is shown in "Projection onto the feature vector" section of the result page. The histograms are plotted for each group (groups #1 and #2). The obtained feature vector with the equilibrium structure can be downloaded as a xyz file. In "Feature vector" section, the feature vector can be visualized by clicking "Vibration on" as shown in the right lower panel.
Usage of Clustering
Please select the kinds of axial ligands, protein function, and threshold of structure resolution to specify a dataset.
For example, if you select the values as shown in the right upper panel, the selected dataset includes the hemes having the axial ligand of "HIS-HIS", "CYS", and "CYS-HOH". The values of structure resolution in the selected dataset are all less than 2.0 Å. The protein function is not used for the specification of the dataset.
In Clustering the projected values of heme structures onto 12 vibrational modes (NSD) are used for the anaysis instead of atomic coordinates.
2. Selection of the target for comparison
Please select the target for which the extracted data is compared. If you select "Axial ligand", the clustering will be carried out for each group of axial ligands as shown in the right lower panel. In the case when "ALL" is checked in the step 1, the histogram will be plotted for one group (whole data). If you would like to compare the distributions among all groups, please uncheck "ALL" and then check all items.
3. Execution
Click the "Analyze" button at the bottom of the page, then the result page will be open in another window or tab. ("Analyze" in white characters represents "ready to search", and that in black ones "lack of selection.")
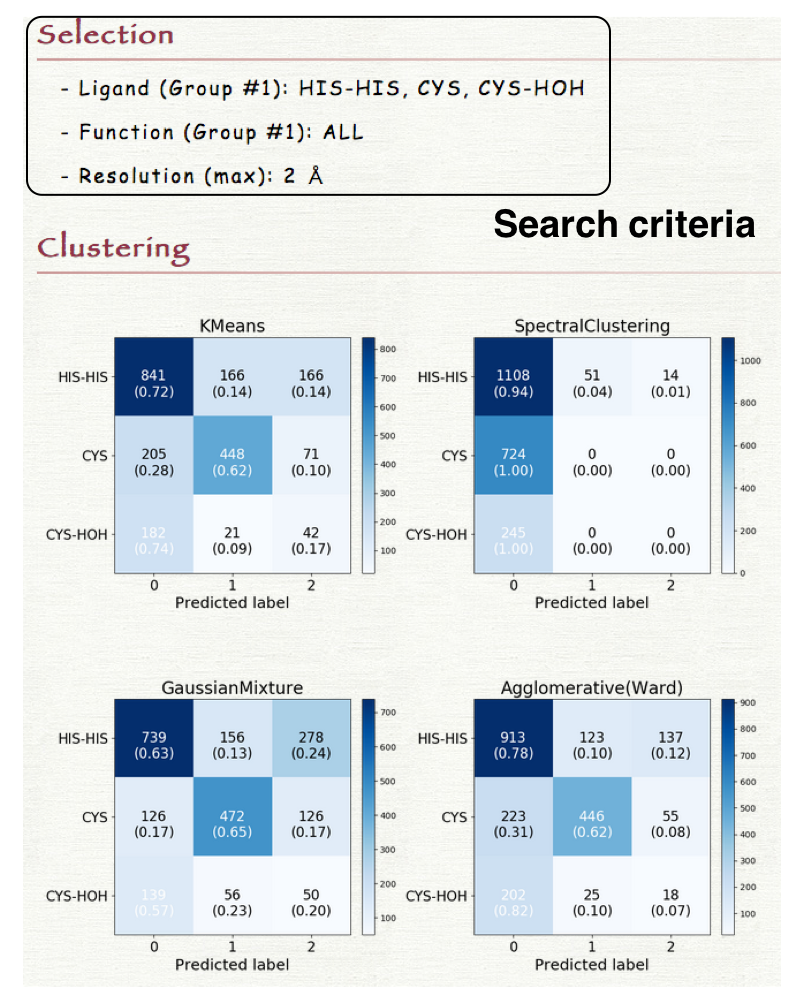
4. Result
The heat map of the group of dataset vs. predicted class will be displayed. The horizontal axis represents the predicted classes, and the vertical axis is the groups of datasets (If you selected "Axial ligand" in the step 2, each kind of axial ligand corresponds to each group).
How to use Browser
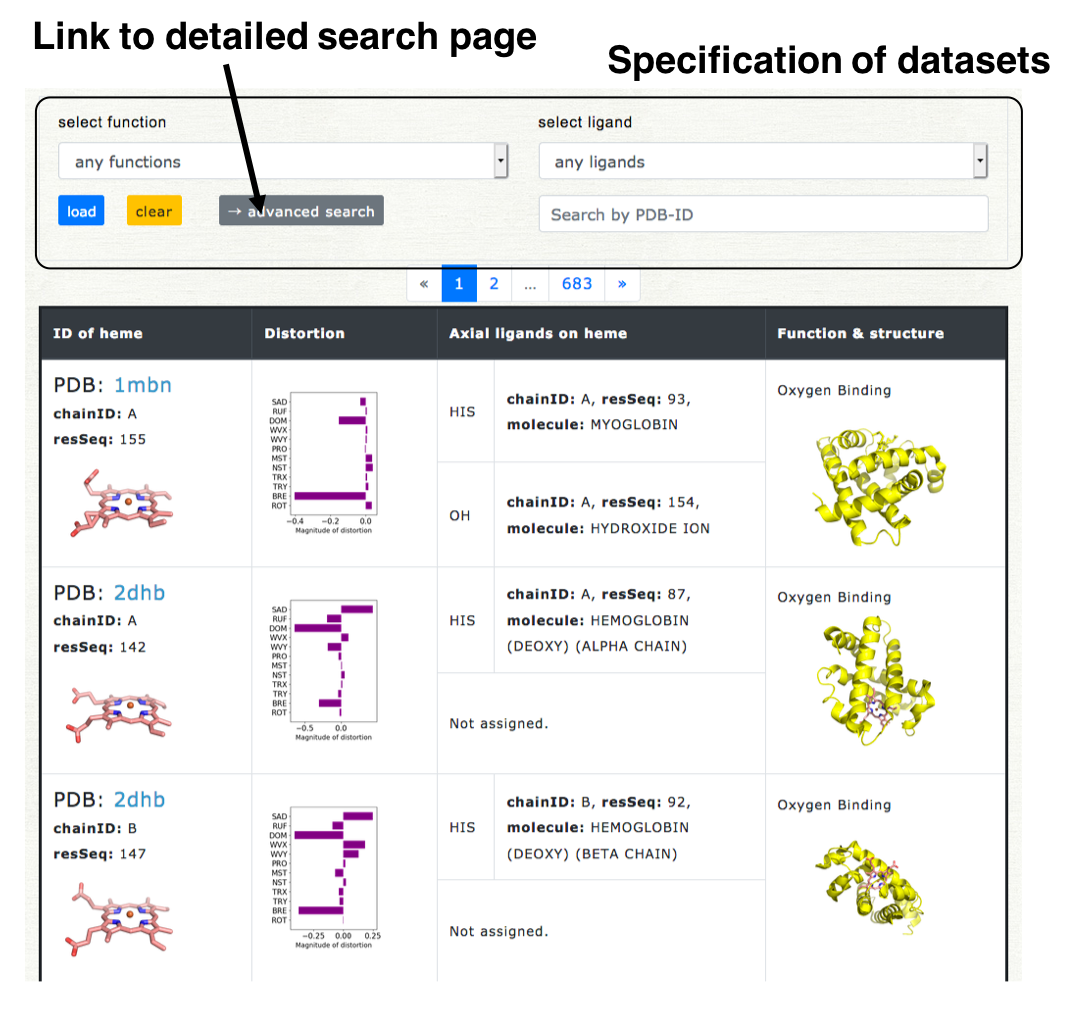
- Column #1: Information about heme entry; PDBID-chainID-resSeq of heme, and molecular structure.
- Column #2: Distortion of heme porphyrin; projected values of the atomic coordinates of porphyrin skelton onto 12 vibrational modes.
- Column #3: Information about axial ligand; residue name in its PDB entry (resname), chain ID (chainID), residue index (resSeq), and molecular description (molecule) in its PDB entry
- Column #4: Protein function and structural information; function, oligomeric count of protein, pocket volume for heme, and out-of-place displacement of Fe atom (Fe-oop).
* All images are enlarged by mouse over on the image.
+ Specification of dataset
The dataset can be specified by the kinds of axial ligand and protein function, or PDB ID. Only one kind can be selected for each (the axial ligand or protein function). "Any ligands" or "any functions" means "not specified." For the search by PDB ID, only one ID is allowed.
Click the "load" button, then the result will be loaded. If you click "clear" button, specification of datasets is cleared and all data will be displayed.
+ Detailed search
More flexible search can be carried out in the detailed search page. The link button to the detailed search page is located on the selection field on the top of Browser page ("Advanced search"). The screenshot of the detailed search page is shown in the right lower pannel. The dataset can be specified by the kinds of axial ligand, protein function, heme type (residue name of heme), and structure resolution.
How to search and download data
Please access Data -> Seach & download data page (a new window will open). In "Seach & download data" page, users can search the data more flexibly than that in "Browser" and can also download the resulted list as a CSV-formatted file.
1. Specification of a dataset
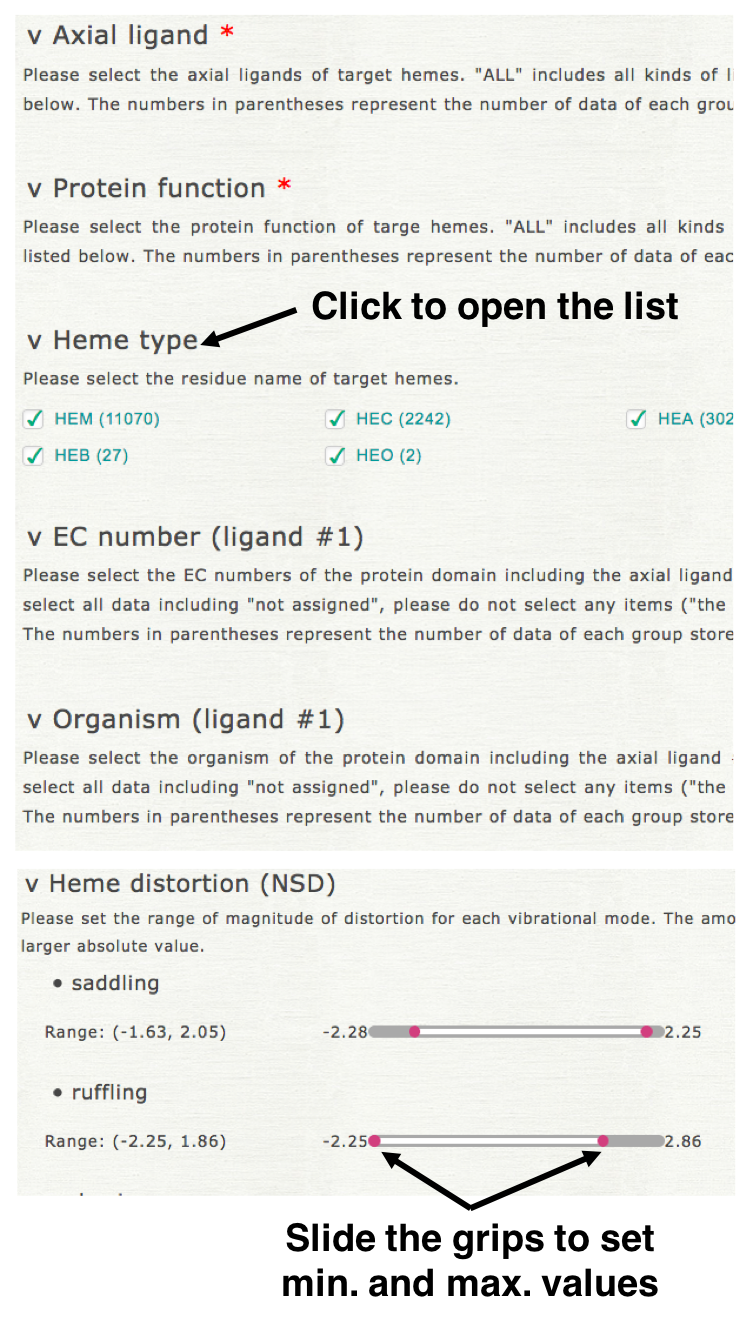
Please select the kinds of axial ligands, protein function, heme type (residue name of heme), EC number (of axial ligand #1), organism (of axial ligand #1), threshold of structure resolution, and magnitude of heme distortion (saddling, ruffling, doming, and breathing) to specify a dataset. Clicking each element name, then open its list of items as shown in the right upper figure. For "axial ligand" and "protein function" more than one item must be selected. For the other elements, the element is not used for the specification of dataset if no item is selected for it.
2. Selection of the items to be displayed
Please select the items displayed in the resulted list (common to browsing & downloading). PDB ID and identifier of heme (chain ID and residue index in its PDB entry) will be displayed at any time.
3. Execution
Click the "Load" button at the bottom of the page, then the result page will be open in another window or tab. ("Load" in white characters represents "ready to search", and that in black ones "lack of selection.")
4. Result
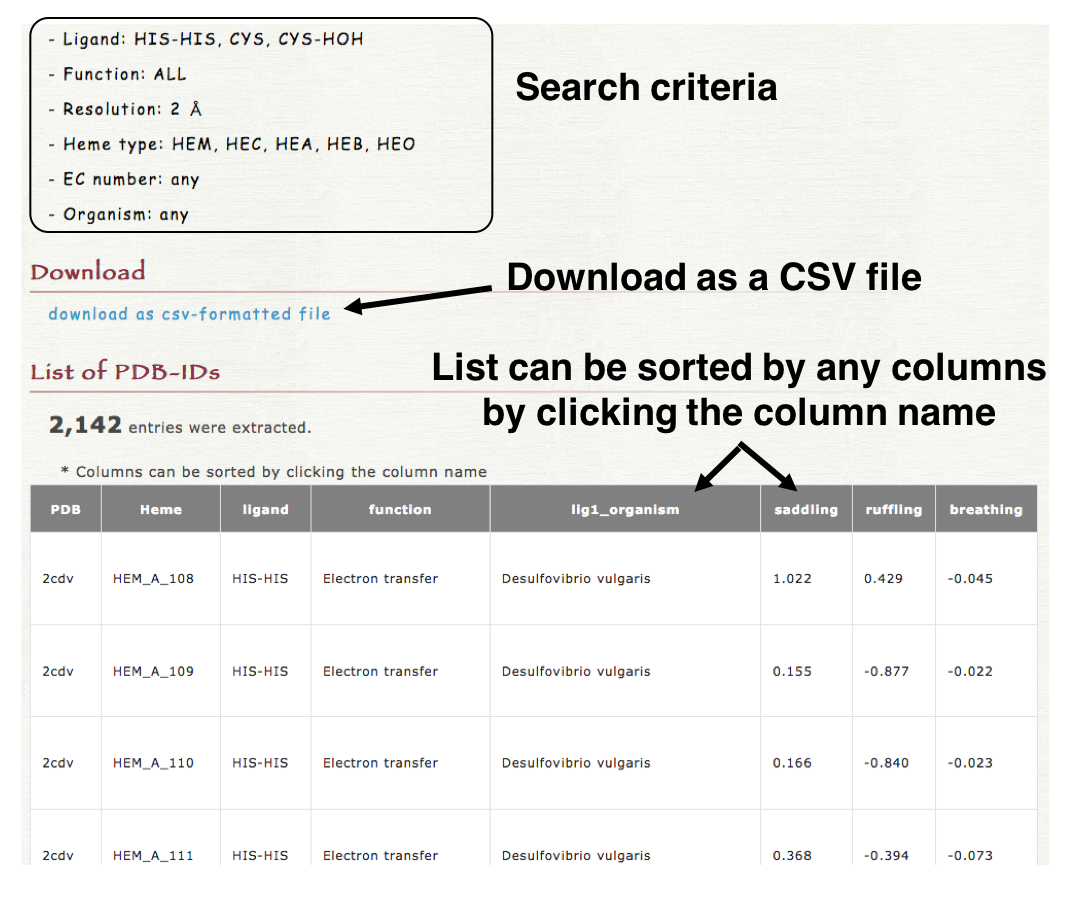
The resulted list can be downloaded as a CSV-formatted file in "Download" section as shown in the right lower panel. The list is also shown in the result page and can be sorted by any columns by clicking the column name (header column).
What to use
What is stored in PyDISH?
For data stored in PyDISH, please see Data page.
How to browse the data in PyDISH?
Please use Browser.
You can browse the data in PyDISH by using Browser. Information about heme (including distortion of porphyrin) and its axial ligands are displayed. The molecular structure of heme and protein domain(s) including its axial ligands is also shown here.
How to download the data in PyDISH?
I would like to search the data by heme distortion.
Please use Search & download data page.
You can get the list of hemes of the selected group. You can specify the dataset by the kinds of axial ligand, protein function, heme type (residue name of heme), EC number and organism of protein domain including axial ligand #1, structure resolution, and the heme distortion (magnitude of distortion of saddling, ruffling, doming, and breathing). The items displayed in the result can be also selected. The resulted list can be sorted by each column. The resulted list can be downloaded as a CSV-formatted file.
I would like to analyze the relationships between distortion of heme porphyrin and kinds of axial ligand, protein function, or protein fold.
Please use NSD.
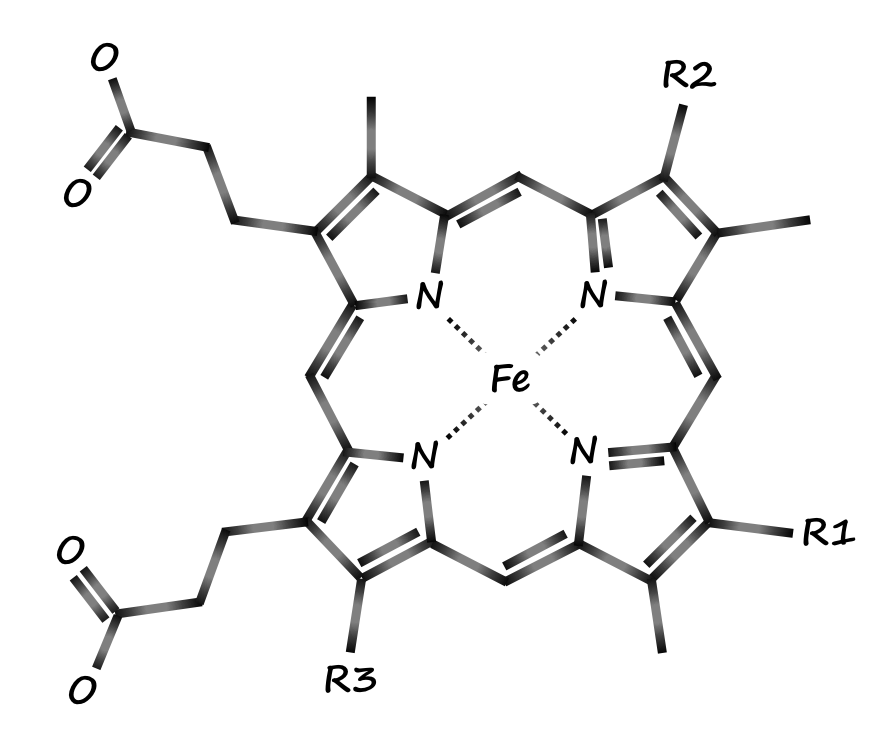
Displacement from the equilibrium structure can be represented by a linear combination of (3N-6) vibrational modes as described below.
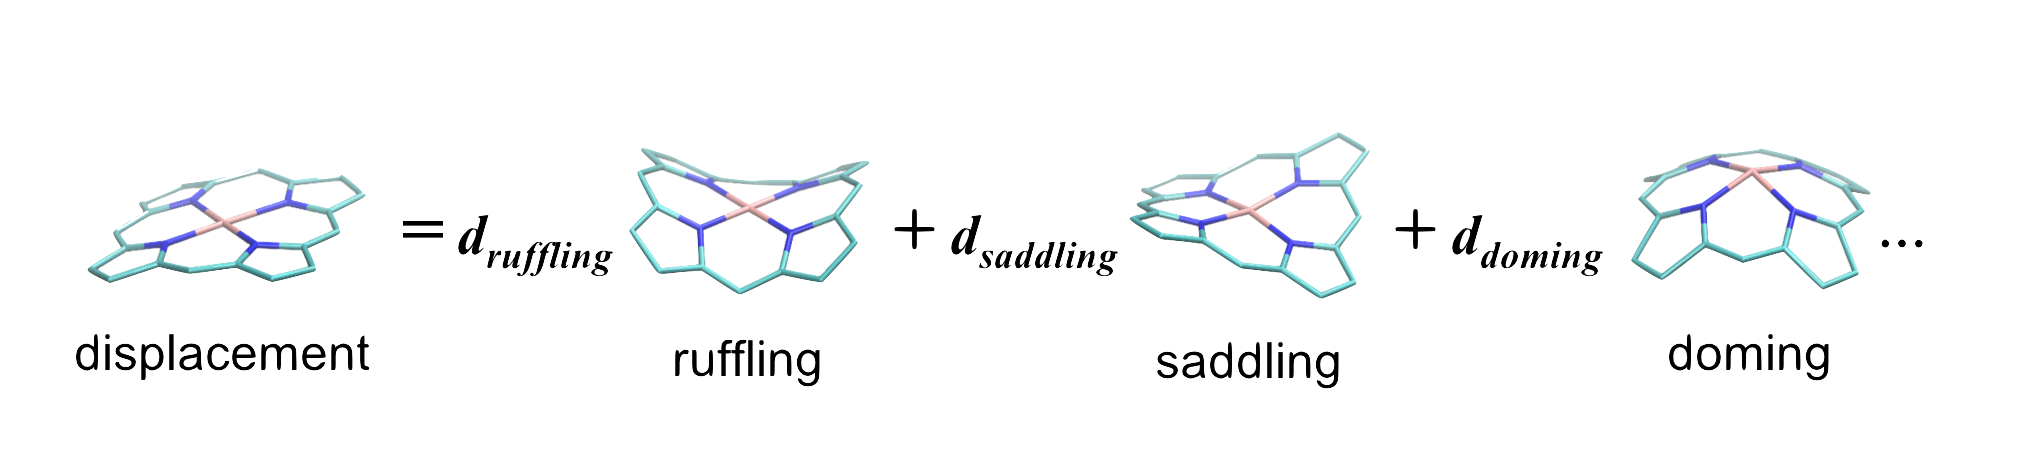
In NSD, you can compare the distributions of 12 vibrational modes by kinds of axial ligand, protein function, or protein fold (CATH level C).
I would like to analyze characteristic conformational difference of heme porphyrin among the selected data.
By using PCA characteristic conformational difference in all data in the selected dataset (3N vectors) will be obtained. Because PCA is a method of unsupervised learning, there is no guarantee that the obrained eigenvectors divide the selected dataset into some clusters. If you would like to obtain the feature vector dividing two groups, please use LDA.