Components
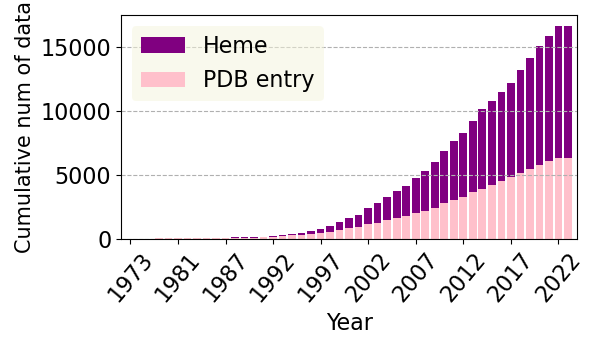
In PyDISH each entry is composed of one heme molecule liganded to a hemeprotein. 20588 entries with 7581 PDB entries. Each entry includes information for the heme, axial ligands and information about them, protein function, orientation of propionate sidechains, structural resolution, and deposition date. The right figure shows the cumulative number of Heme (PyDISH entry) and PDB entry by year.
* You can browse individual components here (Browser) *
Information about each heme
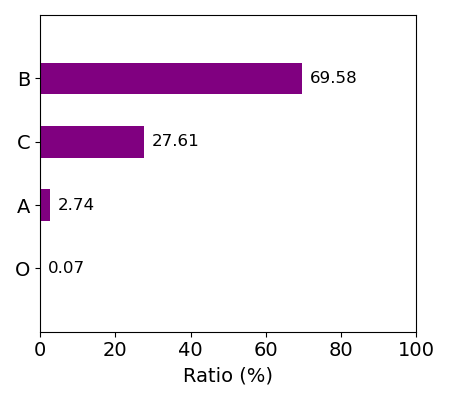
For idetification of the heme in each entry, each entry has the following information about heme: asym_id (molecule id in the PDB file), chain_id (chain id in the PDB file), resSeq (residue index in the PDB file), and heme_type (residue name in the PDB file: HEA, HEB, HEC, HEO, HEM). HEA and HEC represent heme a and heme c, respectively. HEB includes heme b and c. Composition of each kind of heme for whole data is shown in the right figure.
Composition of heme_type
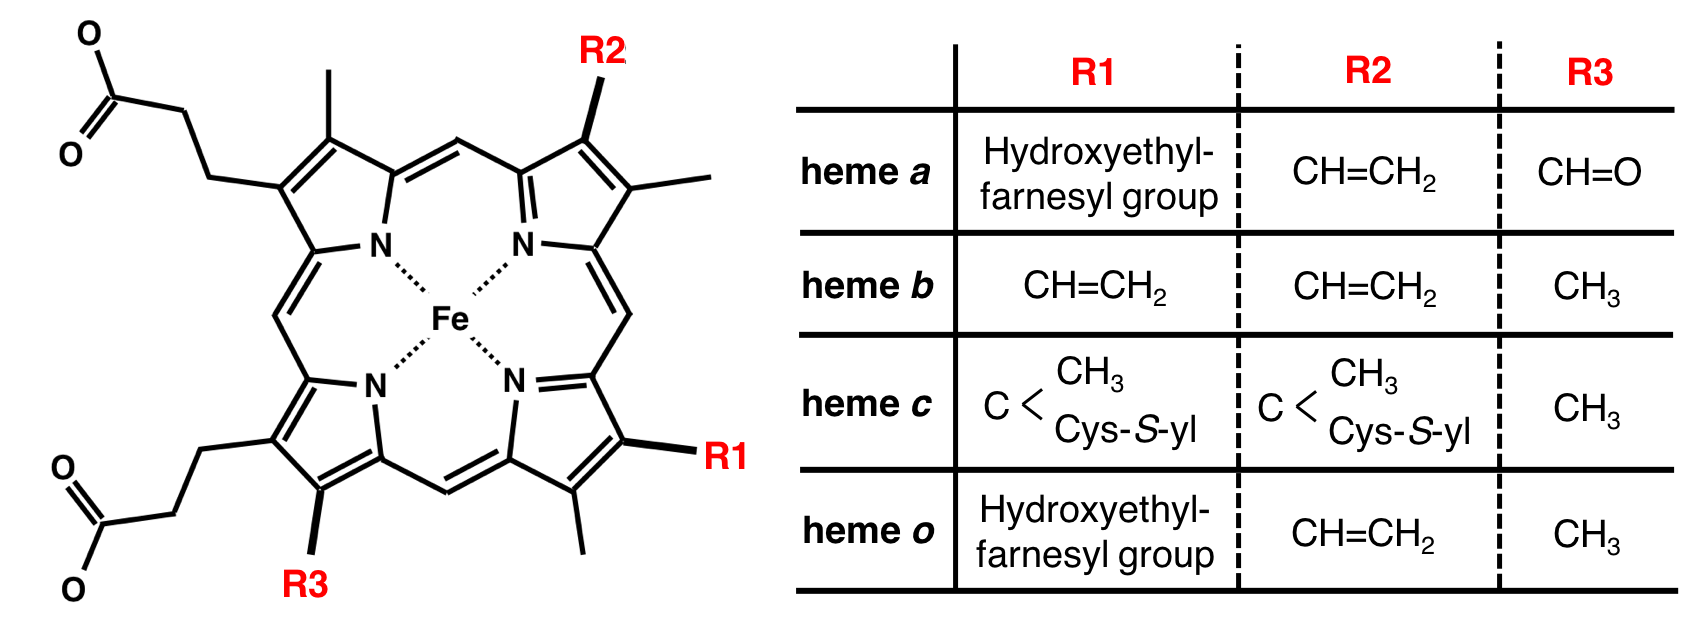
Kinds of heme
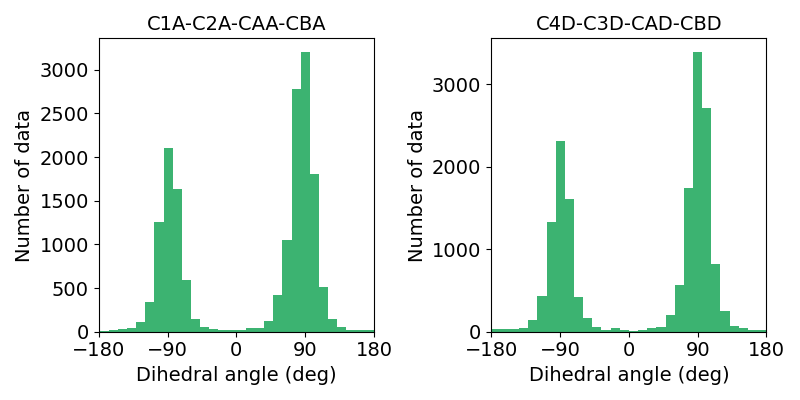
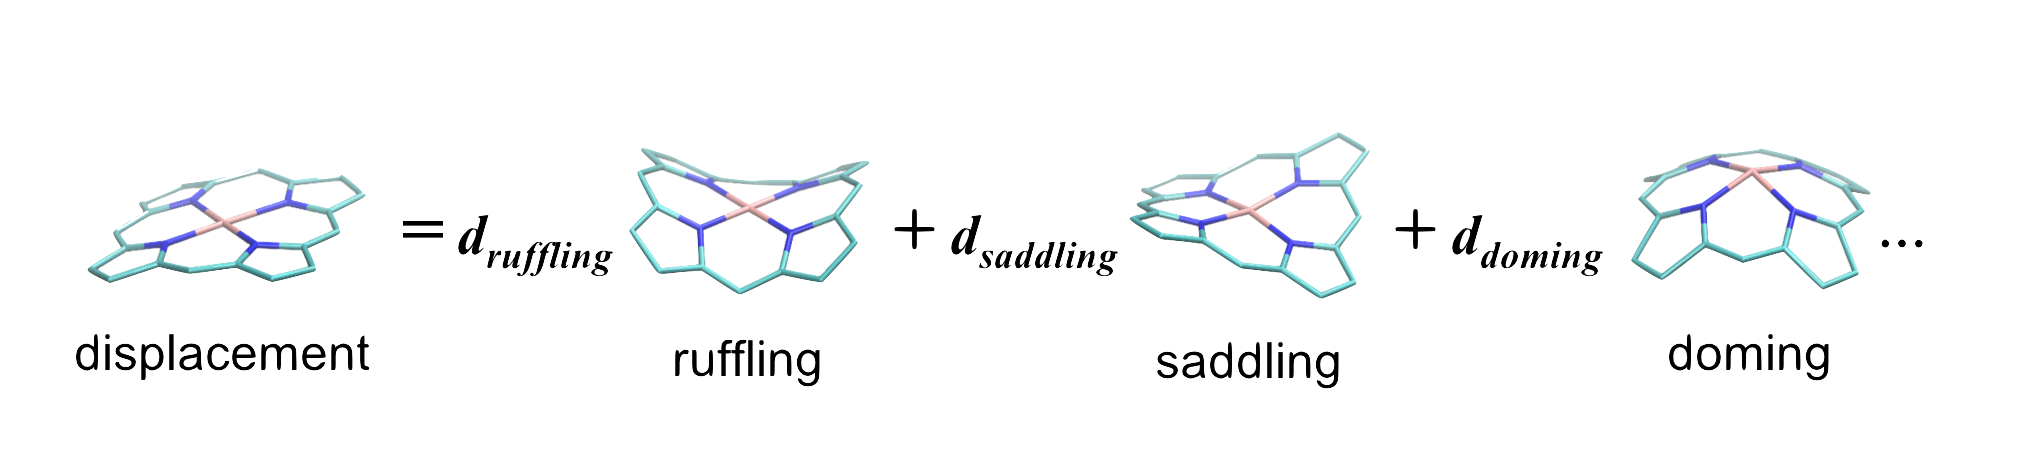
Distortion of heme porphyrin
In order to estimate the distortion of heme porphyrin, we use the normal-coordinate structural decomposition (NSD) in PyDISH. Displacement from the equilibrium structure can be represented by a linear combination of (3N-6) vibrational modes as described below. Each coefficient is calculated as a projected value of atomic coordinates of heme (porphyrin skeleton) onto each vibrational mode. In PyDISH we calculated the projected values for each heme onto 12 representative vibrational modes: Saddling, Ruffling, Doming, Waving(x), Waving(y), Propellering, meso_stretching, N-pyrrole_stretching, Translation(x), Translation(y), Breathing, and Rotation. Larger absolute value means larger distortion along the corresponding mode. These vibrational modes are shown in this page.
Axial Ligands
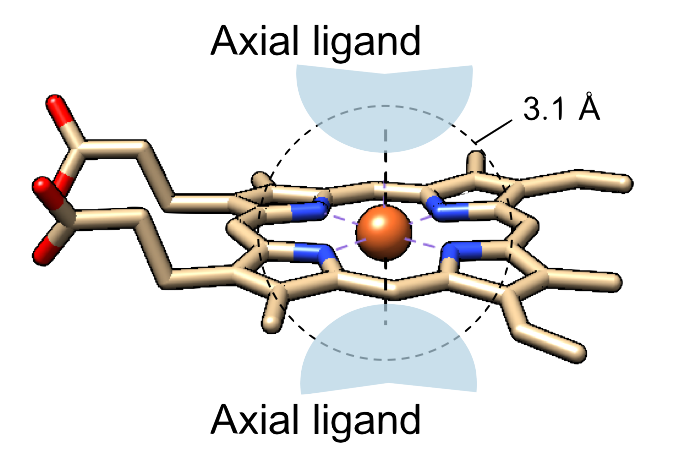
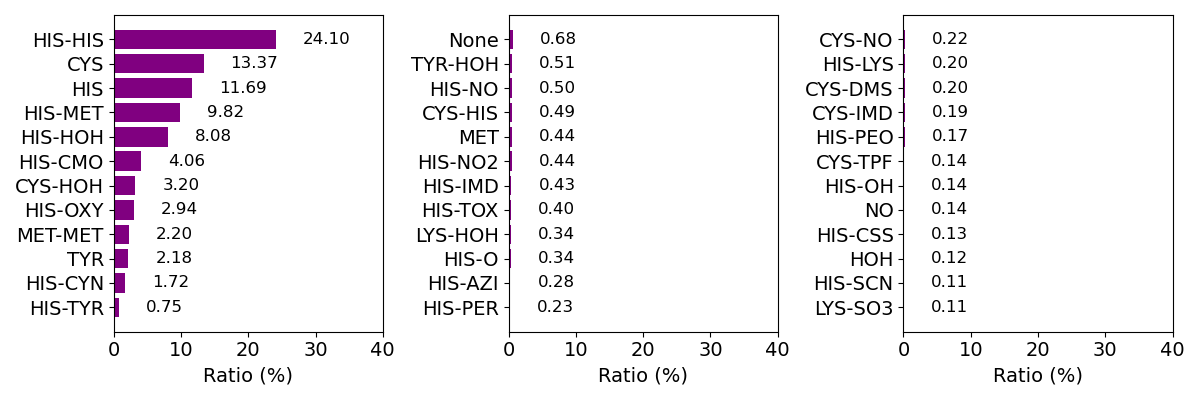
The amino acid residues, molecules, or atoms liganded to the iron ion of heme are treated as axial ligands as represented in the right panel. Axial ligands were identified as the residue or molecule including an atom(s) within 3.1 Å of the iron ion of each heme. We selected 2 nearest neighbors in the case when more than 3 residues and/or molecules were identified. Composition of axial ligands for whole data is shown below.
Composition of axial ligands (top 36)
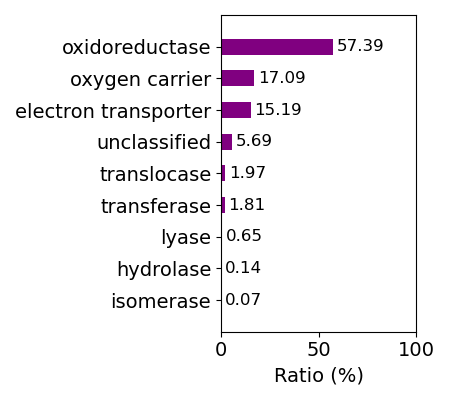
Protein Function
Protein function is defined manually by classifying the descriptions for protein function in PDB files (structural keyword) into some groups. Composition of protein function for whole data is shown below.
* Correspondence table for protein function in PyDISH and PDB is here *
Composition of function
Information about each axial ligand
The following information was collected for each axial ligand in each entry: resName (residue name in the PDB file), chain_id (chain id in the PDB file), resSeq (residue index in the PDB file), molName (description in the PDB file), ec_num (EC number), organism, unp_id (Uniprot ID), cath_c (CATH level C; protein fold), and distance (coordination distanse). For ec_num and organism, we used descriptions in PDB file for the chain including each axial ligand. For cath_c and unp_id, we used CATH ID and Uniprot ID assigned for the domain including each axial ligand because an ID is assigned to a protein domain (there is the case when multiple ids are assigned to 1 PDB entry). In the case when CATH ID or Uniprot ID is not assigned to the domain or when the axial ligand is not an aminoacid, "None" is assigned for these columns. Compositons of protein folds, EC numbers, and organisms for whole data are shown below (right pannel).
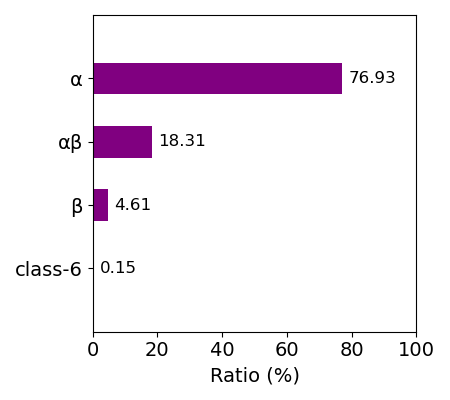
Protein fold (CATH level C)
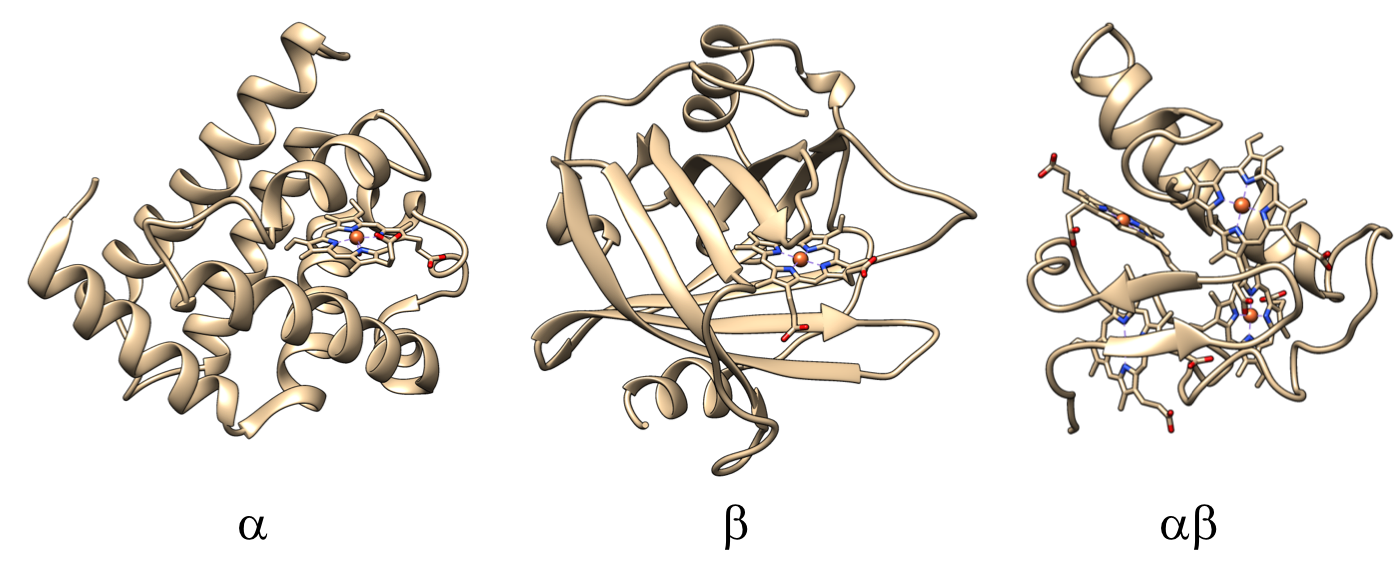
Composition of protein fold
Composition of EC number (top 36)
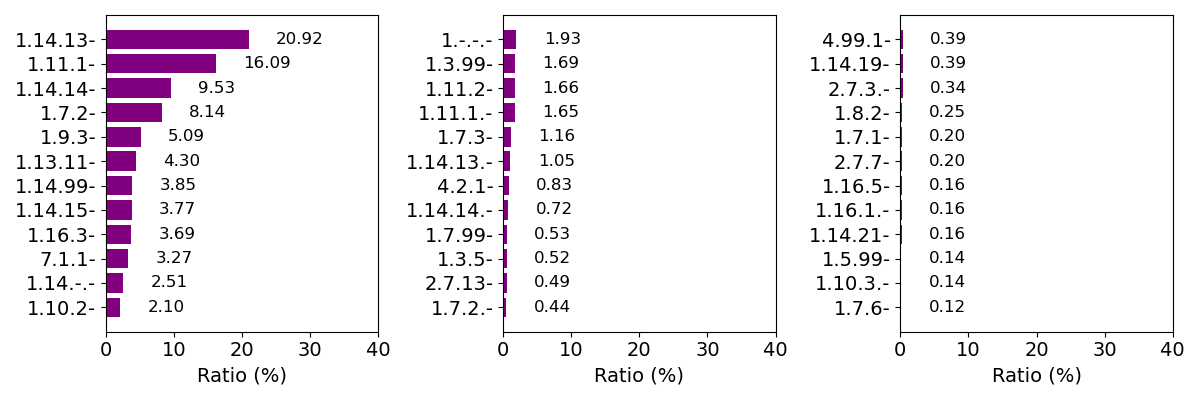
* The definitions of enzyme classes are described in this site
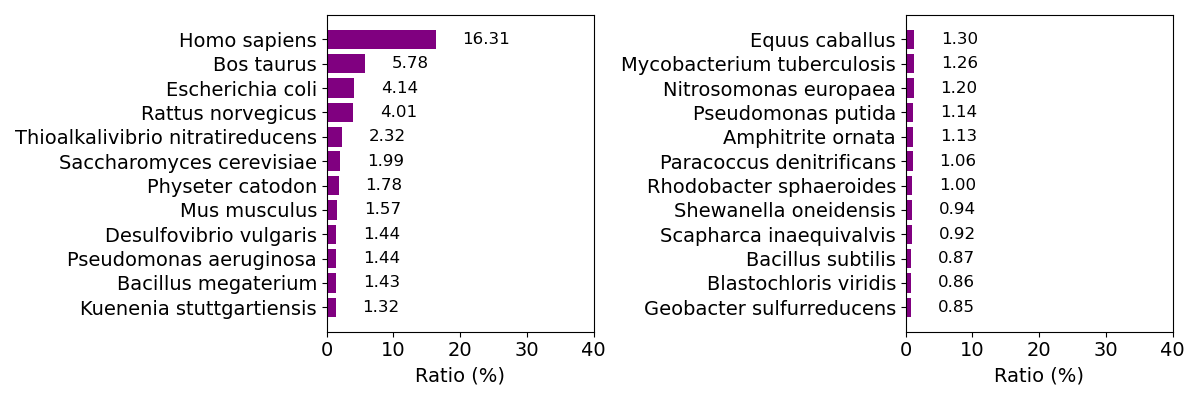
Composition of organism (top 24)
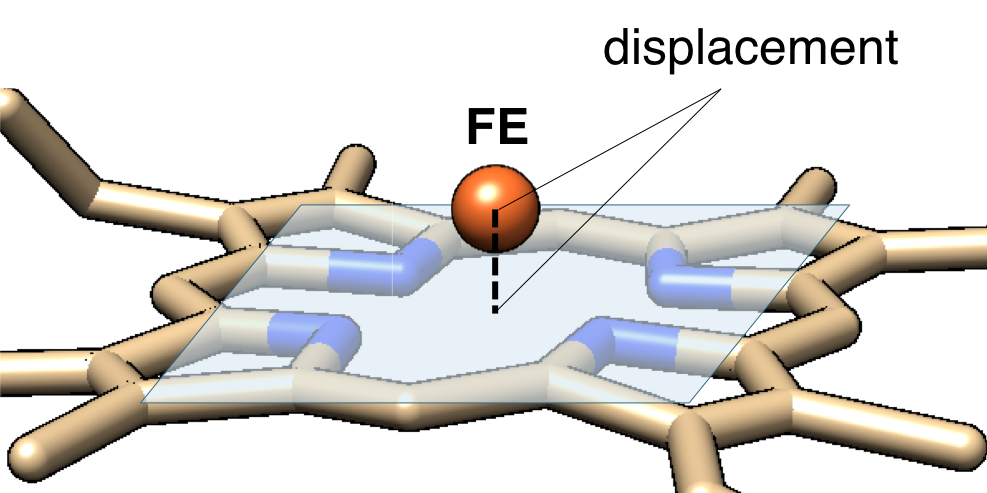
Out-of-plane displacement of Fe
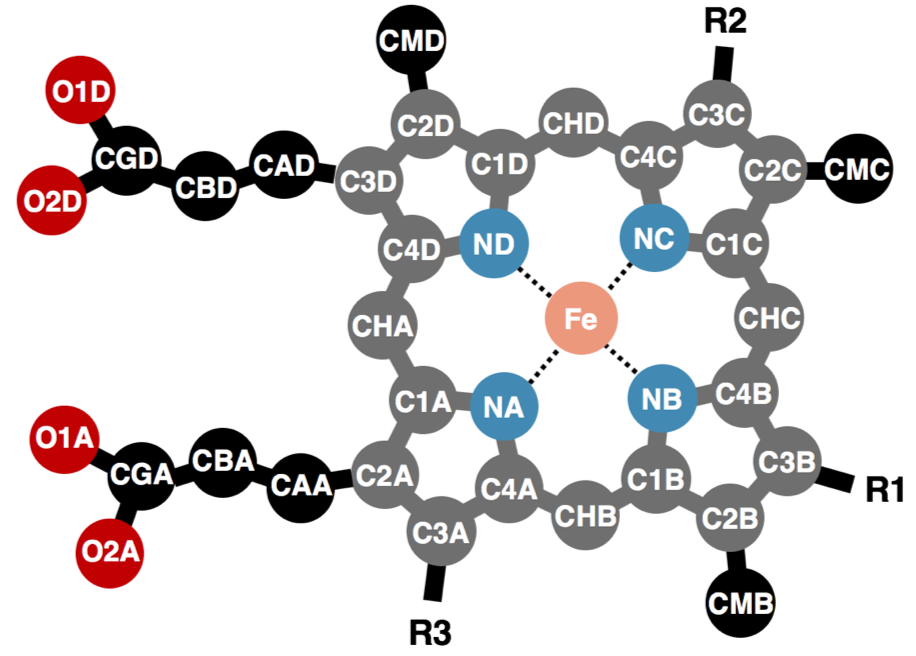
The out-of-plane displacement of the iron ion of heme (FE_disp_N) was calculated as the distance between FE atom and the least square fit plane of the 4 nitrogen atoms (NA, NB, NC, and ND) as shown in the figure below (left pannel).
Out-of-plane displacement
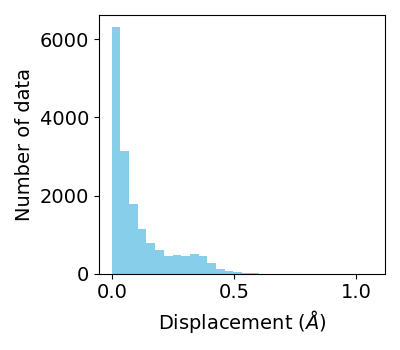
Distribution of displacements of Fe
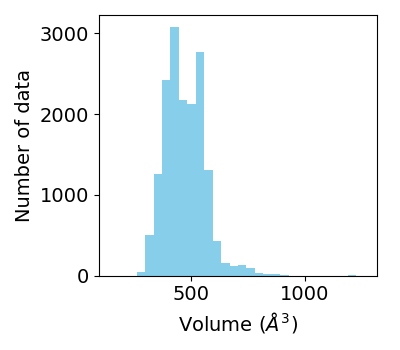
Analysis of heme-binding pocket
The volume of heme-binding pocket (pocket_volume) was analyzed by using POVME python library. In this analysis whole heme structure was used for the binding pocket analysis.
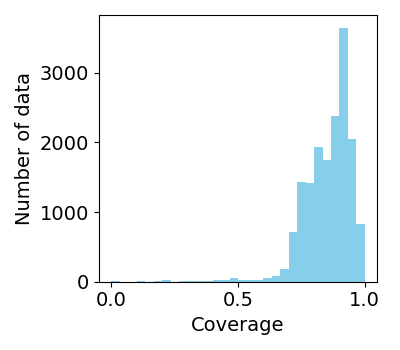
The coverage of heme (coverage) was also analyzed for 25 atoms composing porphyrin skeleton. The solvent accessible surface area (SASA) was analyzed for each atom of the heme-protein complex or isolated heme (Scomplex,i and Sheme,i, respectively) by using MDTraj library. Scomplex,i and Sheme,i were summed for the atoms of porphyrin skeleton, and the coverage was calculated as the ratio of the sum of Sheme to that of Scomplex.
Distribution of pockt volumes
Distribution of coverages of heme